Digital Triage in General Practice: Demand, Workload, and Patient Experience at Scale
From phone queues to hidden work: what digital triage really does

In brief: Over £240 million has been spent rolling out digital triage in English general practice. Using publicly available NHS data from ~6,000 practices, I test four propositions: whether it eases the 8am phone rush (yes, but total morning demand rises), whether it increases demand on the practice (yes — net expansion, not just channel substitution), whether patients are happier (no — satisfaction is markedly lower), and whether clinical outcomes are affected (mostly not — but cancer detection improves in the most deprived areas, while diabetes treatment targets show a small squeeze).
If you’ve tried to contact your GP surgery recently, you may have been asked to fill in a form on a website before anyone would speak to you. The NHS calls this “online consultation” — but the name is misleading. You’re not consulting anyone. You’re submitting a written request into a triage system. A member of staff reads it, decides what you need, and gets back to you — maybe with a phone call, maybe with a text, maybe with an appointment, maybe not until the next day.
This is digital triage: the practice decides what happens, based on what you’ve typed into a form. It has gone by several names — “total triage” during COVID, “Modern General Practice Access” in the 2023 NHS Delivery Plan, “online consultation” (OC) in the official data. I’ll use OC throughout this post — but remember, it means filling in a form instead of phoning, not a consultation. Whatever you call it, the same system is now embedded in thousands of English practices, and over £240 million of public money has been spent rolling it out.
This is a follow-up to my previous Substack post on digital triage in general practice. Since writing that piece, a colleague prompted me to look at the newly available cloud-based telephony (CBT) data — the newest NHS dataset on primary care, capturing inbound call volumes to practices that have adopted cloud phone systems.
At the Health and Care Analytics Conference in December, Ben Goldacre argued that to build the systems and structures around analytics that the country needs, “you will have to be very propositional.” That’s the approach I want to take here: laying out clear, testable claims about what we’d expect to see if digital triage works as intended, and checking them against publicly available NHS data. You can examine each proposition on its merits, and challenge them if the reasoning doesn’t hold.
How we got here
The idea of triaging patient demand through digital tools has been national policy for a decade. The General Practice Forward View, published in 2016, committed £45 million to support the uptake of OC systems in every practice. The logic was straightforward: general practice was struggling with rising demand and a shrinking workforce, and technology could help manage both.
That ambition was sharpened considerably in May 2023, when NHS England published its Delivery Plan for Recovering Access to Primary Care. This introduced the “Modern General Practice Access” model, backed by over £240 million in funding. The plan was explicit about the problem it was trying to solve: the 8am phone rush, where patients feel they must call first thing in the morning to have any chance of being seen that day. The modern model would move away from this first-come-first-served queue. Instead, patients would submit structured information — either via an online form or to reception staff — and the practice would triage and respond throughout the day.
The policy rests on a clear set of beliefs about what digital triage will achieve. It’s worth being explicit about these, because they generate testable predictions.
The theory — and what it predicts
The core belief is this: if you give patients a way to submit their request at any time then all demand can be surfaced and effectively managed. The practice sees the full picture of what patients need, and can allocate its clinical time accordingly. Patients no longer have to battle the phones at 8am because there’s no advantage to calling early; the system processes requests based on clinical need, not speed of dialling.
If this theory is correct, we would expect to see three things in practices that have adopted digital triage at scale. First, the 8am rush should ease, because demand is being submitted throughout the day rather than concentrated in a single phone window. Second, recorded demand should rise, because previously hidden need — patients who gave up on the phone, or didn’t bother trying — would now be visible to the practice. And third — the crucial one — patients should be happier. They no longer have to fight for access. The system is working for them rather than against them.
There’s an assumption buried in this theory that deserves scrutiny: the idea that GPs currently see a significant number of patients who would be better served by other staff or other services. The Primary Care Foundation and NHS Alliance reported in 2015 that 27% of GP appointments were “potentially avoidable” — but that figure was based on 56 GPs self-classifying 5,128 of their own appointments, and was not representative of the wider sector. The evidence base for the scale of “misdirected” demand in general practice is actually quite thin.
That said, the theory is not unreasonable. But is there evidence for it? The ESTEEM trial — a proper randomised controlled trial of telephone triage in general practice, published in the Lancet in 2014 — found that triage increased total contacts by 33% compared with usual care. The contacts were redistributed from face-to-face to telephone, costs were similar, and triage appeared safe. But it didn’t reduce overall workload or clinician contact time. Crucially, ESTEEM was not designed to test whether triage could redirect “avoidable” contacts — it simply found that adding a triage step generated more contacts, not fewer. That was telephone triage, not digital triage — but the underlying logic is similar, and the finding should give us pause. Let’s see what the current data shows.
The data
I’ve used several publicly available NHS datasets, all for February 2026: appointment records from Appointments in General Practice, the General Practice Workforce Census, OC submission volumes, the GP Patient Survey (GPPS) 2025, and the English Indices of Multiple Deprivation 2025.
A note on GPPS timing: the survey is conducted once a year, with fieldwork running in early 2025 — roughly 11 months before the February 2026 OC data. This is the closest available survey.
For most of the analysis — appointments and satisfaction — I’ve used approximately 6,000 practices with OC submission data, split into three equal groups (tertiles) based on their OC submission rate per 1,000 registered patients per working day. The low third processes fewer than 1.6 submissions per 1,000 per working day. The high third processes more than 8.5 — a roughly fivefold difference in OC intensity.
For the 8am rush analysis, I’ve used a smaller set of about 4,300 practices that have both OC and cloud-based telephony data. CBT is the newest of these datasets and not all practices are yet contributing, so requiring both data sources narrows the sample. This subset tends to be slightly larger, less deprived, and higher OC-using than the full 6,000 — which is why the tertile thresholds are a bit higher (low OC below 2.1 per 1,000 per working day, high OC above 9.3).
One more thing about the OC data. From February 2026, OC submissions are split into clinical and administrative categories. Overall, about 65% of submissions are clinical (a patient describing a health problem that needs clinical assessment), 24% are administrative, and the rest are other or unknown. Not all submissions will need clinical review — the administrative ones can often be handled by reception or admin staff. But in high-OC practices, the clinical share is higher: 67% versus 57% in the low group. So the practices processing the most OC submissions are not simply handling more admin; they are receiving proportionally more demand through this route that does need clinical input.
Does the 8am rush ease?
This is where the CBT data comes in. The CBT dataset records inbound calls to practices — every call that rings, whether it is answered or not. There are two kinds of 8am rush, and they behave differently.
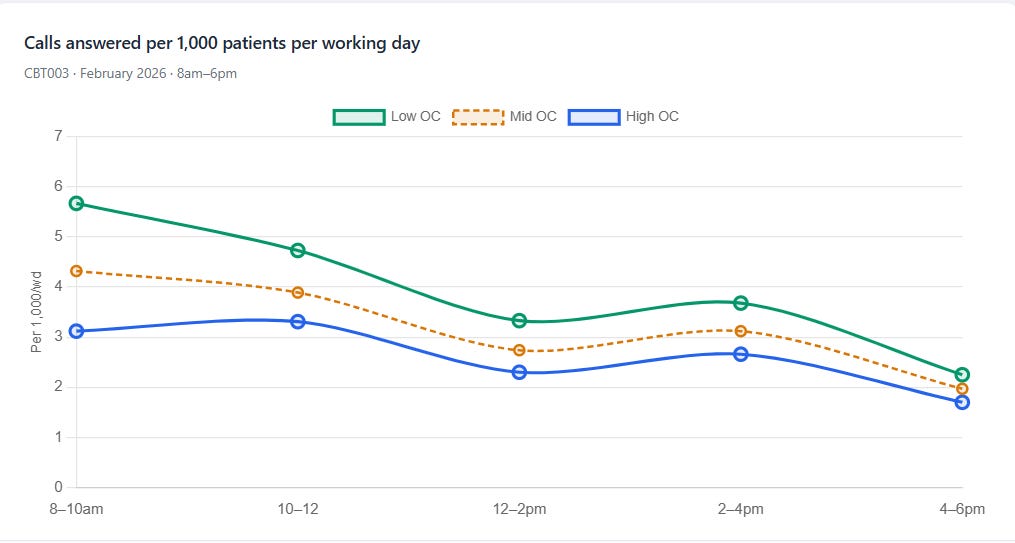
The first is the phone rush. In low-OC practices, 35% of all daily inbound phone calls arrive in the 8–10am window. That proportion falls to 25% in high-OC practices. Fewer phone calls overall, and a smaller share of them concentrated first thing in the morning. Moreover, the answer rate in that window improves: 52% of 8–10am calls are answered in the low-OC group versus 58% in the high group. So the phone rush does ease.
But there is a second rush. OC submissions also peak in the morning — 42% of all OC submissions in high-OC practices arrive in the 8–10am window. When we count the demand that actually lands on the practice — answered calls plus OC submissions (since unanswered calls don’t generate work) — high-OC practices receive 8.4 contacts per 1,000 patients per working day in that two-hour slot, versus 6.0 for low OC. That is 40% more actionable morning demand, not less. And 33% of the day’s actionable demand lands before 10am, compared to 29% for low-OC practices. OC doesn’t end the 8am rush. It makes it worse.
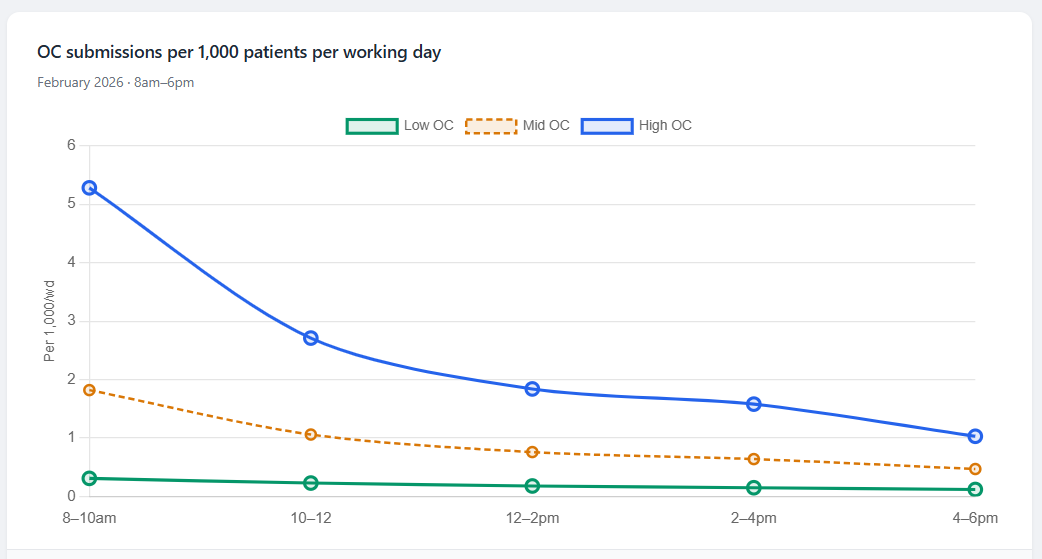
The structural explanation is straightforward. Digital triage does not remove queuing — it replaces a visible, time-limited bottleneck (phone lines that open at 8am) with an always-open intake system that increases throughput in peak periods. A phone queue has a natural capacity constraint: lines are busy, patients redial, some give up. An online form has no such constraint. Everyone who wants to submit at 8am can do so simultaneously. The result is not the elimination of the morning rush but its amplification — and because two-thirds of OC submissions are clinical, the workload they create is real.
Behavioural factors may compound this. Patients may carry over the habits of the phone queue, assuming that early submissions get faster responses. Practices may implicitly reinforce that assumption. But the core mechanism is architectural, not behavioural: lower access friction at peak times means higher peak throughput.
And….practices may limit submissions once their ‘capacity’ is full. Because deep down this is a capacity issue, rather than an access issue. If that happens and patients know this then they will still continue to log their requests early in the morning.
Does visible demand rise?
Looking at actionable demand — answered calls plus OC submissions — across the rush analysis practices; this is higher in high-OC practices: 25.5 per 1,000 patients per working day versus 20.7 in the low group. The composition shifts dramatically — from almost entirely phone-based to nearly half OC — but the total work arriving at the practice is not the same. It is higher. This is not just channel substitution — phone calls declining while OC rises — but net demand expansion. That was partly the intention: the theory holds that an always-open, low-friction intake route will surface need that was previously hidden behind an engaged phone line. The question is whether the system can absorb the demand it has surfaced.
On the appointments side, practices in the highest OC tertile deliver about 25 appointments per 1,000 patients per working day, versus about 23 in the lowest. So there is some increase in recorded activity — but this is modest, and here is a important point.
The work of processing triage submissions is extremely unlikely to be fully captured in appointment data. In the traditional model, demand flows through a simple sequence: patient contacts practice → appointment is booked → clinical work is recorded. In the OC model, a new intermediate layer appears: patient submits form → clinician reads, assesses, and may respond with advice, a prescription, or a redirect → and only sometimes is an appointment booked. That clinical processing layer — the reading, the thinking, the text-based responding — consumes clinician time but does not consistently generate a recorded appointment.
In the high-OC group, practices are processing over 12 OC submissions per 1,000 patients per working day. Two thirds of these are clinical. The appointment data shows us the visible tip of the workload; beneath it sits a substantial volume of clinical processing that we simply cannot measure with the data available. This is not just a measurement gap — it has consequences. Workforce planning models that rely on appointment counts will underestimate the clinical time consumed by OC. Productivity metrics that divide appointments by staff will make OC-heavy practices look less busy than they are. And any policy evaluation that uses recorded activity as its denominator will systematically undercount what these practices are actually doing.
Are patients happier? No — they’re less satisfied
This is where the theory runs into the most trouble. If the modern access model is working as intended — surfacing demand, managing it effectively, ending the phone battle — patients at high-OC practices should report better experiences.
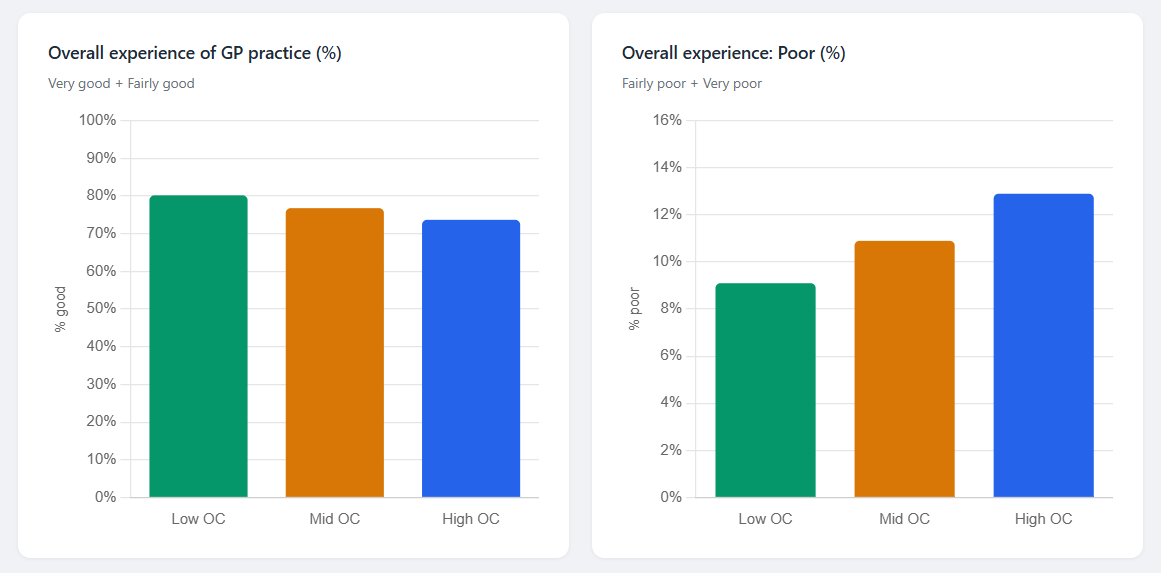
That is not what the data shows. Overall “good” experience is 80% in low-OC practices but only 74% in the high group. The gradient runs across every GPPS domain: how patients contact their surgery, how easy they find the process, and how quickly they hear back about next steps. The charts on the dashboard show this in detail.
A regression on all 6,012 practices lets us decompose the 6.5 percentage-point gap between low and high OC groups. OC rate accounts for 4.9 of those 6.5 points. List size — high-OC practices are 58% larger — adds another 1.2 points. Deprivation works in the opposite direction: because the high-OC group is less deprived, it contributes +0.6 points that should narrow the gap, not widen it. Age profiles are near-identical and contribute nothing. The gap isn’t explained by who these practices serve.
There is also the question of digital exclusion. Patients who can’t or won’t use online forms may find it harder to access high-OC practices — and if their experience is worse as a result, the satisfaction data may actually understate the problem. The GPPS has a response rate of around 27%, and its own technical reports show that people in deprived areas, younger patients, and men are systematically under-represented. If digitally excluded patients are both less satisfied and less likely to respond, the gap we observe is a floor, not a ceiling.
But what about clinical outcomes?
An obvious response to the satisfaction findings is: so what? Maybe digital triage makes patients less happy but produces better care. A system that effectively triages demand might catch conditions earlier, manage chronic disease better, or reduce emergency admissions. That’s a perfectly reasonable hypothesis — and we can partly test it. But it’s worth being clear about what kind of intervention OC is. It is not a clinical intervention — it doesn’t change what happens in the consultation room. It is an access and logistics intervention: it changes how patients reach the practice and how demand is sorted. We should expect its effects on clinical outcomes to be indirect and modest, and that is largely what we find.
I chose two practice-level outcome measures, for different reasons. From the National Diabetes Audit 2024–25: diabetes care process completion and treatment target achievement. These measure whether the slow, routine work of chronic disease management is being done — exactly the kind of work that might get squeezed if practices are under demand pressure. And from Fingertips Cancer Services: the cancer detection rate via urgent suspected cancer referral. This is an access-sensitive measure — patients need to get through the door and be referred for their cancer to be picked up this way.
Given the lower satisfaction at high-OC practices, the headline finding is reassuring: on the big picture, OC adoption makes very little difference to clinical outcomes. Diabetes care process completion is 57–59% across all three OC tertiles. Cancer detection rates are 53–54%. Patients are still getting broadly similar care regardless of how heavily their practice uses digital triage.
But there are two signals worth noting — one encouraging, one less so.
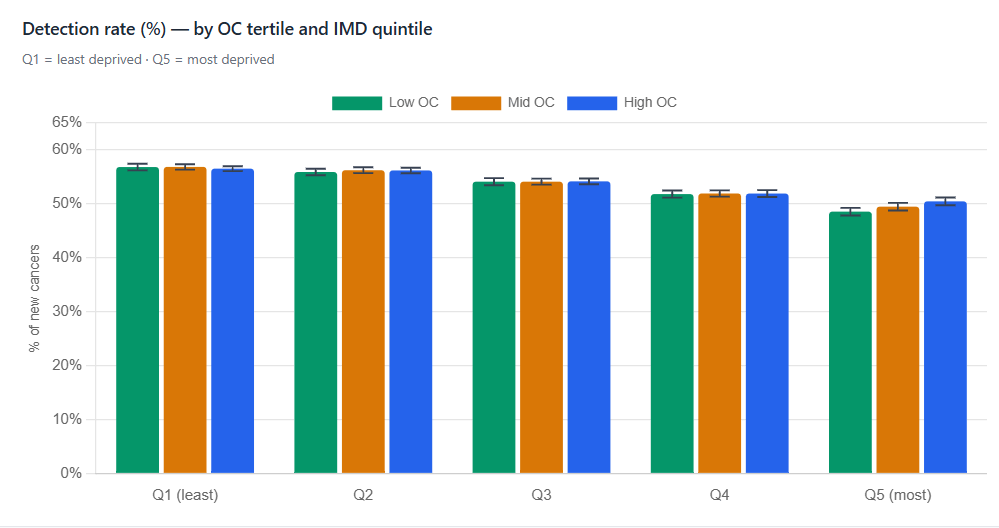
Cancer detection in deprived areas. When we break the data down by deprivation, something interesting emerges. In the less deprived practices, cancer detection rates are essentially identical regardless of OC use (~57%). But in the most deprived quintile, high-OC practices detect significantly more cancers via urgent referral than low-OC practices: 50.4% versus 48.5% (p < 0.001). This is the only quintile where a statistically significant difference appears. The deprivation gap in cancer detection — the difference between the most and least deprived practices — is 8.3 percentage points in low-OC practices but only 6.1 in high-OC practices. A formal regression with an interaction term confirms this: the relationship between OC and cancer detection becomes more positive as deprivation increases (p = 0.001), after adjusting for practice list size and deprivation.
What might this mean? Cancer detection through urgent referral is fundamentally about access — a patient needs to reach the practice, describe their symptoms, and be referred. In deprived areas, where barriers to getting through on the phone may be highest (shift work, caring responsibilities, language barriers), an online form that can be submitted outside surgery hours or without needing to wait on hold could lower the threshold to getting seen. This cuts against the digital exclusion point made earlier — and that tension is real. OC may simultaneously exclude some patients who struggle with digital tools while making access easier for others in the same community who struggle with phones during working hours. We can’t prove causation from this data — practices that adopt OC heavily in deprived areas may differ in ways we can’t measure (better leadership, more stable staffing, a culture of proactive referral), and it may be those organisational qualities, not OC itself, that drive the difference. But the signal is there, and it is consistent with the access hypothesis.
Treatment targets: a small squeeze on routine care. The 3 treatment targets show a small but consistent gradient running the other way. Low-OC practices achieve 46.2% versus 45.1% in the high group — just over one percentage point. The pattern persists within every deprivation quintile: low-OC practices do slightly better in each one. In a regression adjusting for deprivation and list size, OC rate remains a statistically significant negative predictor of treatment target achievement (p < 0.001), though it explains very little of the overall variation. Larger practices also achieve fewer treatment targets, independently of OC.
This could reflect a genuine trade-off: if practices under the most demand pressure are both the ones adopting OC most and the ones finding it hardest to deliver the slow, routine work of chronic disease management — the regular reviews, the medication titration, the follow-ups. Or it could simply be confounding: the kinds of practices that attract high OC demand (younger populations, urban areas, more acute need) may have always achieved slightly lower treatment targets for reasons that have nothing to do with digital triage. Either way, this connects to the hidden workload problem described earlier. If the clinical processing layer generated by high OC volumes is consuming time that would otherwise go to routine chronic disease management, the treatment target gradient may be a downstream consequence of demand expansion — not of digital triage failing, but of it succeeding in surfacing more acute demand than the system can absorb without trade-offs. There is also a continuity question. Chronic disease management benefits from relational continuity — a clinician who knows the patient, tracks their progress, and adjusts treatment over time. Both larger practices and triage-based models tend to fragment that relationship: interactions are processed by whichever clinician is on triage duty rather than by the patient’s usual doctor. If OC erodes continuity, the treatment target gradient may partly reflect that loss. Continuity has known associations with both patient satisfaction and chronic disease outcomes — and its erosion could plausibly mediate some of the patterns observed across this whole analysis.
What this means for the inverse care law. The 2026/27 GP contract states that “Our focus this year is GP capacity, supporting the shift from treatment to prevention through changes to the Quality and Outcomes Framework (QOF) and vaccinations and enabling practices to prioritise clinically urgent needs.” General practice is the vehicle through which much of that shift is supposed to happen. If we care about health inequality — the inverse care law — the question is not just whether OC affects average outcomes, but whether it widens or narrows the gap between rich and poor.
On cancer detection — the access-sensitive measure — the gap narrows. On diabetes care and treatment targets, it doesn’t change. Digital triage doesn’t appear to be making health inequality worse, and in one important area it may be helping. But it isn’t the transformative equaliser that the policy ambition might hope for. And the faint signal on treatment targets is worth watching: if the workload generated by high OC volumes is quietly squeezing out the preventive, routine work of chronic disease management — or if triage-based models are eroding the relational continuity on which that work depends — that matters. Not because the effect is large now, but because the 10 Year Plan depends on general practice being able to do more of that work, not less.
These are blunt measures, and finer-grained outcome data — ambulatory care sensitive emergency admissions (the kind that good primary care should prevent) — is not currently published at practice level. Until it is, the outcome question remains partly open. But the data we have suggests that patients at high-OC practices are still getting broadly similar clinical care — even as their experience of accessing it is markedly worse.
What this doesn’t prove
This is cross-sectional data from a single month. Practices aren’t randomly assigned to use OC at different rates — they adopt systems based on local decisions, commissioner incentives, and patient demand. There are likely unmeasured confounders. We don’t know what would have happened to these practices without OC; their satisfaction might have been even lower without an online option.
These are propositions, not conclusions. Each one could be wrong, and I’d welcome challenge on any of them. The data is public and the methods are straightforward — and you can explore them yourself on the interactive dashboard.
What the data suggests is this: digital triage solves a narrow problem well — it eases phone congestion — but it creates new pressures that the policy debate has not yet reckoned with. It expands the total demand landing on the practice. It generates a layer of clinical work that is invisible to the systems we use to measure general practice activity. And it is associated with lower patient satisfaction in a way that cannot be explained by the populations these practices serve. It is not a neutral change at system level.
General practice is under enormous pressure, and "Modern General Practice Access" represents a serious attempt to address it. But the model was adopted as national policy before the evidence base was established. The data presented here suggests a more mixed picture than the policy assumes — and that matters, because the 10 Year Plan depends on getting this right. These propositions are offered in that spirit: not as a case against digital triage, but as questions that deserve answers before the model is treated as settled.
The views expressed here are my own and do not represent those of my employer. This work was carried out in my own time. I have no commercial conflicts of interest.
Data sources: NHS Digital Appointments in General Practice (February 2026), General Practice Workforce Census (February 2026), Online Consultation submissions (February 2026), Cloud-Based Telephony inbound calls (February 2026), GP Patient Survey 2025, English Indices of Multiple Deprivation 2025, National Diabetes Audit 2024–25, Fingertips Cancer Services (2020/21–24/25). Satisfaction and outcomes analysis covers ~6,000 practices; rush analysis covers ~4,300 practices with both CBT and OC data.